



Executive comparison: where capital meets user visibility
Comparative analysis starts with a simple proposition: hardware visibility drives utilization, and utilization drives revenue. A site deploying a car parking display sees measurable reductions in search time and attendant congestion; that outcome must be weighed against installation and integration cost. This piece compares fixed-display-first approaches with app-first and sensor-only alternatives, focusing on metrics that matter to CFOs and asset managers—payback period, maintenance load, and residual value.
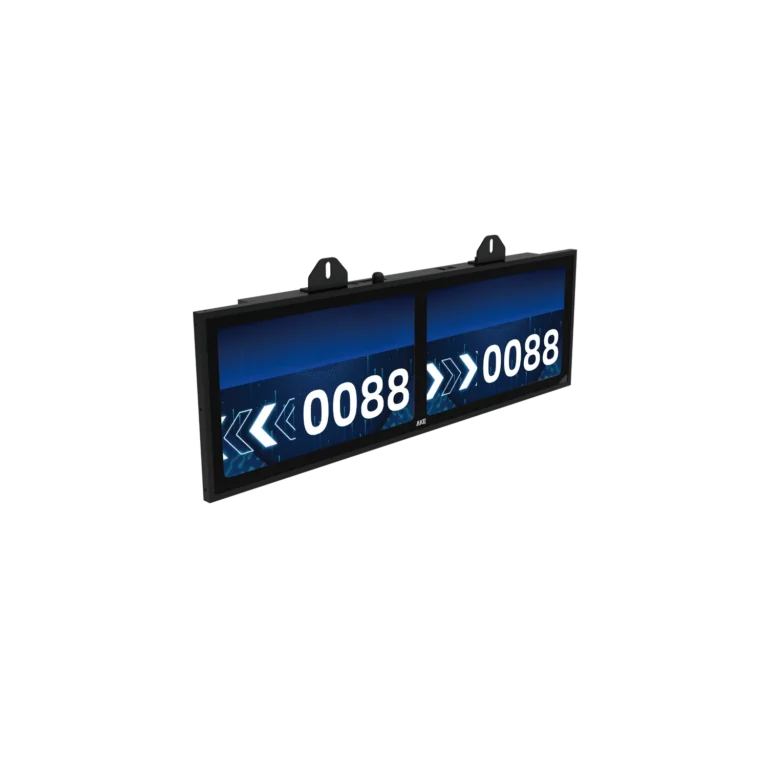
Feature trade-offs: displays, sensors, and backend integration
LED bay indicators and indoor LCD panels offer immediate behavioral cues; they cost more upfront but reduce labor and transaction friction. Sensor-dominant solutions present lower hardware visibility but scale easily and compress per-space cost. Mobile-centric systems minimize on-site hardware but transfer discoverability burden to third-party apps and require high user adoption. Select based on expected dwell time, turnover rates, and customer willingness to use apps—high-turnover airport and mall decks favor visible displays, long-term lease structures favor backend sensor aggregation.
Quantitative criteria for vendor selection
Use three financial filters: (1) total cost of ownership over 5 years (CAPEX + discounted OPEX), (2) measurable revenue impact (reduced search time × increased throughput or paid sessions), and (3) SLA-driven availability tied to penalties. Require vendors to supply sample NPV scenarios and mean-time-to-repair metrics. Prioritize modular systems with documented APIs and standard protocols to avoid expensive rip-and-replace cycles. Expect installation labor to represent 20–40% of project cost in urban multi-level facilities.
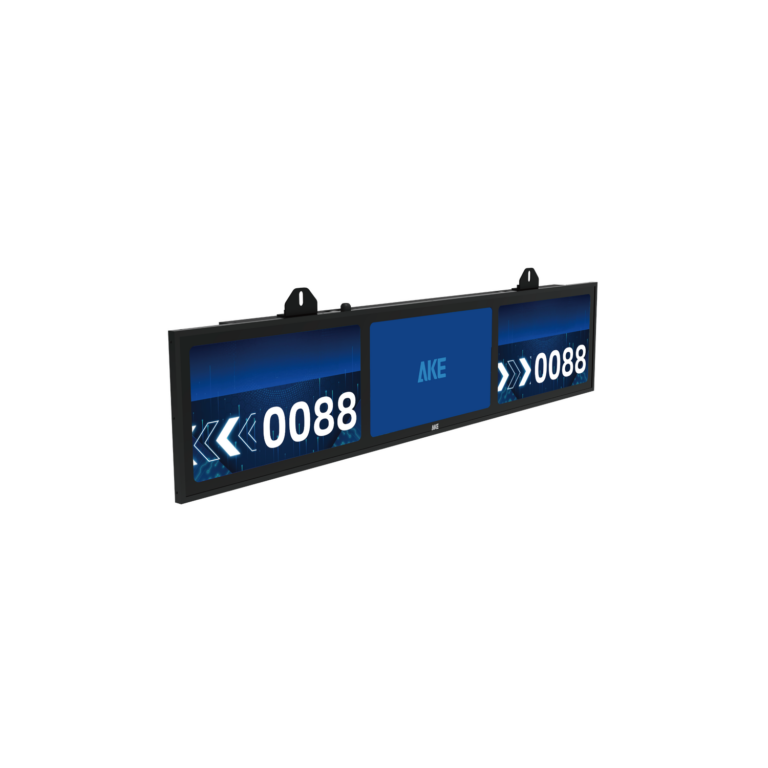
Operational and technical pitfalls to avoid
Underestimating integration complexity is the most common error. Legacy payment systems, proprietary sensor protocols, and weak site cellular coverage all increase hidden costs. Poorly specified brightness, font size, or placement for indoor displays yields negligible user benefit despite hardware expense. Neglecting remote firmware management and cybersecurity provisions allows small failures to cascade into large revenue losses. Require field acceptance testing under peak conditions and a defined rollback plan for software updates.
Real-world validation, standards and trust signals
Transport for London (TfL) ran parking guidance pilots that demonstrate how visible, reliable signage materially affects urban traffic flow and curb utilization—these programs are widely reported and referenced in municipal procurement discussions. For buyers, trust signals include published case studies with measurable before/after KPIs, independent lab test reports for luminous intensity and ingress protection, and compliance with recognized ITS forums. Technical due diligence should examine the display’s refresh latency, API authentication model, and support for centralized fleet firmware updates. For a practical reference point when evaluating hardware, consider vendor documentation for a tested parking display system and compare those specs to procurement requirements.
Alternatives evaluated briefly
Mobile-first: lowest capital but high adoption risk and limited on-site impact. Sensor-only: cost-efficient at scale but lacks immediate user guidance. Hybrid (displays + sensors): highest initial cost, strongest operational results for high-turnover sites. Choose hybrid when you require both real-time driver guidance and robust occupancy analytics; choose sensor-only for long-stay, low-turnover portfolios where visibility matters less.
Decision checklist for procurement teams
Require: site-specific ROI projections, third-party lab spec sheets, SLA with monetary remedies, firmware rollback policies, and a staged pilot. Quantify installation labor and network upgrades separately from hardware CAPEX. Negotiate API access and data export rights to preserve future flexibility. Validate readability under target ambient light conditions and confirm spare-parts supply chain lead times.
Concluding synthesis
For decision-makers balancing capital discipline and operational performance, the comparative view is decisive: visible displays materially reduce friction where driver turnover is high, while sensor and mobile approaches lower unit costs in long-stay contexts. The optimal procurement blends measurable financial metrics with technical safeguards—modular hardware, open APIs, and documented field performance—so the chosen solution delivers predictable uptime and quantifiable returns, a practical outcome exemplified by AKE Parking.